
Climate Table Rio de Janeiro
Jan | Feb | Mar | Apr | May | Jun | Jul | Aug | Sep | Oct | Nov | Dec | |
|---|---|---|---|---|---|---|---|---|---|---|---|---|
| Max. Temperature | 30° | 30° | 29° | 27° | 26° | 25° | 25° | 25° | 25° | 26° | 26° | 28° |
| Min. Temperature | 23° | 23° | 23° | 21° | 20° | 18° | 18° | 18° | 18° | 20° | 20° | 22° |
| Sun Hours | 7 | 7 | 7 | 6 | 6 | 6 | 6 | 7 | 5 | 5 | 6 | 6 |
| Water Temperature | 25° | 25° | 26° | 25° | 24° | 23° | 22° | 22° | 22° | 22° | 23° | 24° |
| Rain Days | 13 | 11 | 9 | 9 | 6 | 5 | 5 | 4 | 5 | 11 | 10 | 12 |
The hottest months in Rio de Janeiro are January and February, where temperatures can reach 30 °C in the shade. On the lower end the coldest months in are June, July, August and September, where temperatures seldom exceed 18 °C.
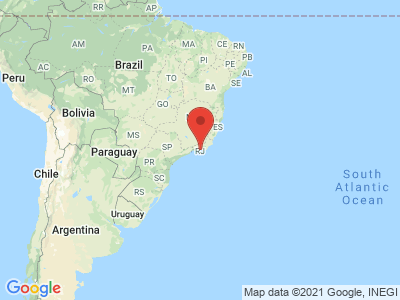
Map view of Rio de Janeiro
Latitude: -22.908519
Longitude: -43.239421